
Every pattern from SECTION-PATTERNS.md rendered in Stamen's voice, plus the brand-specific signature patterns. All copy is verbatim or in-voice with the live site.
hero-photo-led
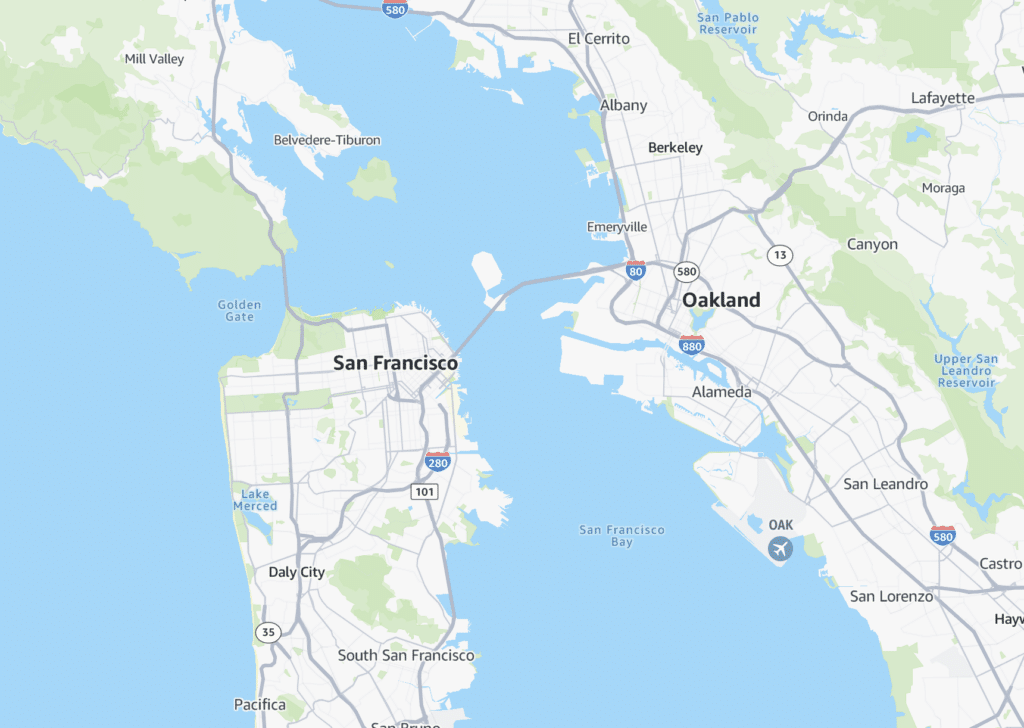
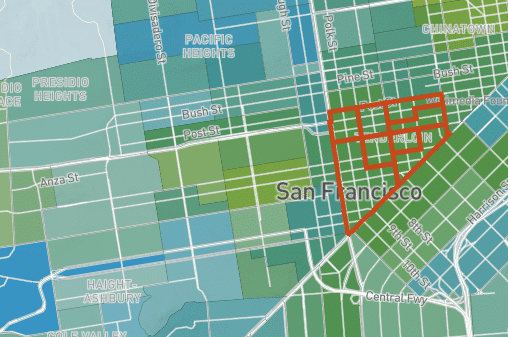
Asymmetric left-aligned hero — wordmark scale headline on the left, a real piece of project work on the right. No gradient blobs.
A data visualization and cartography studio. Our work lives in museum collections, on news front-pages, and inside Google's products.

hero-centeredTypography-only hero. No photo. For internal landings, manifesto pages, give pages.
Most studios bolt visualization onto a finished story. We let the data shape the story. There is no "one size fits all" project for Stamen.
intro-statementSingle editorial paragraph, often following a hero. Sets the studio's posture in 1–3 sentences.
Our ability to find and illuminate the story in the data is central to how we work, and it's what makes us unique.
three-cardCanonical value-prop block. In Stamen voice: the three service lines (storytelling · cartography · interactive).
Reports, data journalism, real-time narratives. We help our clients find and tell the stories in their data.
Learn more 02Visually stunning, technically sophisticated digital maps — every stage of map production.
Learn more 03Dashboards, analysis tools, navigable interfaces grounded in real data insight.
Learn moremap-trinity-showcase SignatureThe Toner / Watercolor / Terrain trinity — Stamen's strongest visual citation. Rendered here as CSS evocations (not real tiles). Always with style names as captions.
image-right-text-leftMid-page narrative beat. Text on the left, image on the right.
A full design refresh of Amazon's global basemap tiles. Shipped in 2023, refined in 2024 for legibility at every zoom level — from continental down to neighborhood.
The challenge: serve every possible developer use-case (delivery routing, asset tracking, retail planning) with one coherent basemap. We took inspiration from the Toner discipline — let the data do the work, let typography carry the load.
Read case study →
image-left-text-rightFlipped variant. Image left, text right. Used in alternation with above to create visual rhythm.

Geographic disparities in California health outcomes, made navigable for researchers, journalists, and policymakers.
Built with our signature data-romance — every county is interactive, every metric defensible, every story rooted in the published literature.
Read case study →staff-gridTeam listing. 4–12 cards.
Eric Rodenbeck
Founder & CEO
Jen Tickle
Senior Designer
Alan McConchie
Senior Cartographer
Sarah Bell
Design Technologist
staff-profileSingle-person feature with photo, bio, and reading-now sidebar.
Founded Stamen in 2001 in San Francisco's Mission District. Speaker at TED, OFFF, Mappy Hour, and dozens of other venues. National Design Award (Smithsonian) recipient.
"We want to be more effective than we are efficient" — a framing borrowed from McDonough and Braungart's Cradle to Cradle, and the closest thing to a Stamen mission statement.
Full bio →
Cradle to Cradle
McDonough & Braungart
beliefs-list top-rule variant of value-tileWhen you need a numbered top-rule grid (label above headline). Add .top-rule modifier to .value-tile.
Our small size means we take a highly personalized approach.
Depth, breadth, and a love of complicated problems.
Positive impact in our communities and in the world.
We design from data, not the other way around.
what-were-about Signature · live-site exactStamen's flagship 4-up "What we're about" block. Vertical YELLOW LEFT-RULE on each tile, lowercase headline. Below the grid: centered .btn-yellow-shadow "Work With Us" CTA with the hard 8×8 offset shadow.
Our ability to find and illuminate the story in the data is central to how we work, and it's what makes us unique. We design from data, and not the other way around.
There is no "one size fits all" project for Stamen. Our small size means we take a highly personalized approach, emphasizing collaboration and flexibility with our clients.
We've got depth, and we've got breadth. We love tackling big, thorny and complicated projects, and we love to learn new things.
We exist to make data insightful and actionable. And we're quite serious about our work having a positive impact in our communities and in the world.
services-dark Signature · live-site exactBlack-ground section that hosts the 4 plant icons in white outline as a service-tile grid. This is the ONLY place on the live Stamen site where all four plant icons appear together — they ARE the service iconography, not decorative ornaments.
museum-credits-strip SignatureHorizontal strip of museum names — the trust marks that work better than client logos. Used above footer or at top of About.
client-grayscale-grid SignatureGrid of real client logos, grayscale 65% opacity, hover → full color. From the live /about/ page.


reading-now-card SignatureA card with an inline yellow eyebrow and a book reference in Georgia italic. Echoes the Rodenbeck Cradle to Cradle reference.
Cradle to Cradle: Remaking the Way We Make Things
William McDonough & Michael Braungart
How to Lie with Maps
Mark Monmonier · 3rd edition
design-by-doing-block SignatureThe brand's signature phrase rendered at hero-scale, lowercase, with full-yellow fill on the strongest word.
design by doing
We design from data, not the other way around. Every engagement is an opportunity for invention and discovery.
faq-sectionAccordion-style FAQ with toner-rule top border and + → × rotate toggles.
Most projects run 3–9 months. Short data-storytelling pieces can land in 4–6 weeks; full-stack cartography platforms typically run 6+ months with a maintenance contract after launch.
Yes, for tightly scoped deliverables. For research-led engagements (most of our work), we prefer T&M with a budget cap — invention is hard to fixed-bid.
Yes — distributed via stadiamaps.com/stamen since 2023. Free tier available for low-volume use; paid tiers for production.
Always. We co-design — your brand, our craft. We've extended design systems for Google, National Geographic, the Washington Post, and dozens more.
Yes. 2-day in-studio intensives in cartography and data viz. Public workshops 2–3 times per year; private workshops on request.
cta-bandFull-width conversion moment. Yellow ground (default) or black ground (alt).
We're a small team — every project comes with founder-level attention.
Toner, Watercolor, and Terrain — free for low-volume use via Stadia Maps.
closing-blockFinal editorial moment before footer. Reassurance or directive in 1–2 sentences.
design by doing
25 years of practice. Transparency, curiosity, and joy — three things we keep coming back to. Tell us what you're working on.