AI as a Design Medium
This article first appeared in Harvard Design Magazine on May 4, 2026. For the past two years I have been teaching a course at the Harvard Graduate School of Design called "Re-imagining the Archive." The premise is simple: take collections that are supposed to stabilize knowledge and treat them instead as something you can work on, work through, and sometimes work against.
Read article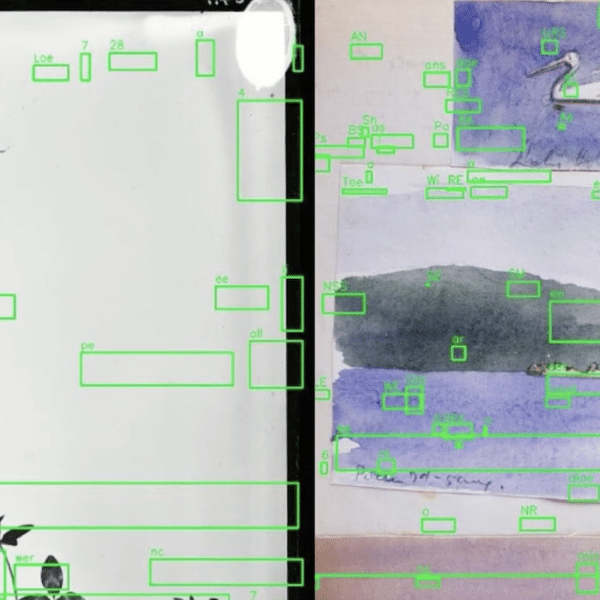
Map makers! Fill out the 2026 Cartographic Design and Development Workflow Census
In advance of a talk planned for the State of the Map US conference in Madison, WI, we're researching the existing map design and development tooling landscape. Tell us about your tools, the gaps, and how your workflow could be improved.
Read article
Exploring the ecclesiastical map of the Catholic Church in the US
A collaboration with a researcher at Boston College — mapping the ecclesiastical jurisdictions of the Roman Catholic Church across the United States. What we learned about parish boundaries, archdiocesan structures, and how the data is recorded.
Read article
Navigate your city car-free with MetroMatch
A new open-source tool that helps people find walkable, transit-friendly neighborhoods anywhere in the US. Built on a foundation of OpenStreetMap data and Stamen's signature cartographic restraint.
Read article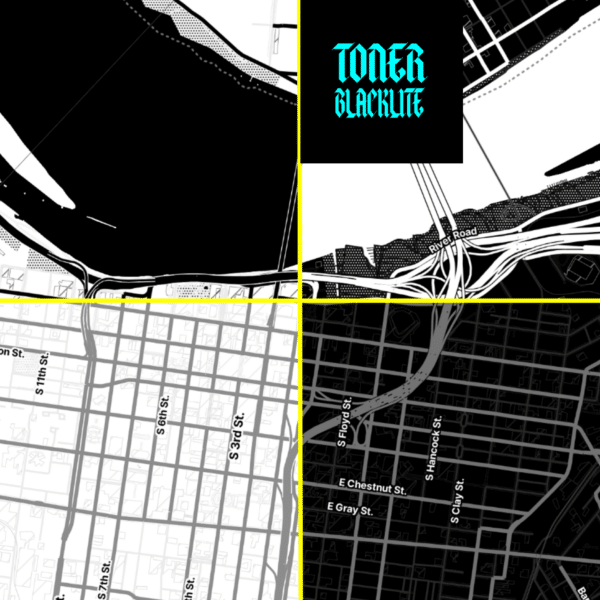
Stamen's Dark (Map) Materials
A meditation on Toner Dark — the brooding sibling of our most-loved basemap style. What makes a "dark mode" map actually legible, and why most attempts fail. Reading Philip Pullman alongside cartographic typography.
Read article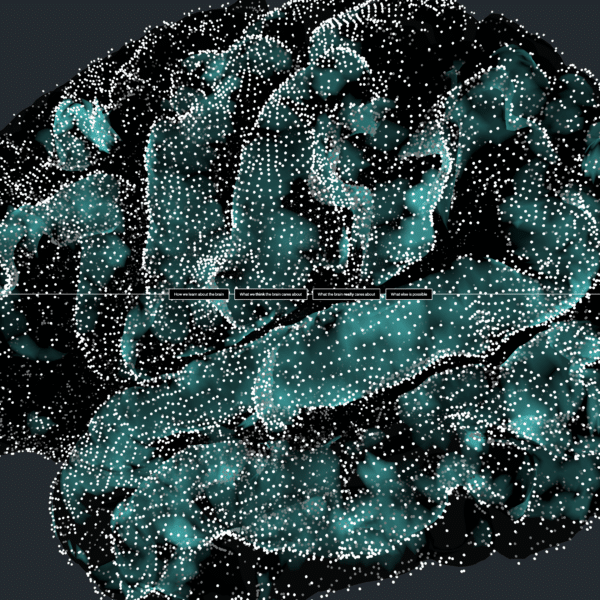
Brain Cartography: Mapping a place that everyone knows, but (almost) no one has ever been
A long-running project with neuroscience collaborators — mapping the human cortex as if it were terrain. What does it mean to map an interior? What conventions translate, and which break down completely?
Read article
Two upcoming workshops at Harvard GSD
Two 2-day intensives this fall at the Harvard Graduate School of Design — one on cartographic typography, one on data-driven storytelling for designers. Open enrollment for students and outside-school participants.
Read article
Data visualization and mapping for a scientific audience with USGS Midwest Climate
Recap of a 3-day workshop with the USGS Midwest Climate Adaptation Science Center's Summer Symposium. Teaching cartographic and data-viz craft for an audience of climate scientists.
Read article
Reflections from the DATA | ART Symposium
Notes from a multi-day symposium on the intersection of data visualization and contemporary art. The questions that emerged about ethics, attribution, and the slow erasure of the dataset as authorial subject.
Read article