We exist to make data insightful and actionable. Dashboards, analysis tools, navigable interfaces — all grounded in real insight, never decoration.
We build interfaces that let researchers, journalists, executives, and citizens actually use the data — not just look at it. Make their data insightful and actionable.
Internal dashboards, public exploration tools, analyst interfaces, decision-support systems — anywhere navigation through data is the product itself.
We work in your stack or ours. We've got depth, and we've got breadth. We love tackling big, thorny and complicated projects.
| Layer | Tools we work in | Notes |
|---|---|---|
| Front-end | React · Svelte · Vue · vanilla JS | Framework-agnostic. We pick to match your team. |
| Visualization | D3 · Observable Plot · MapLibre · deck.gl · Three.js | WebGL when the data demands it; SVG when print-publish matters. |
| Geo | MapLibre · Mapbox GL · Leaflet · MapTiler · custom WebGL | Vector tiles by default. Raster fallbacks for legacy. |
| Data pipeline | Python · DuckDB · BigQuery · Postgres + PostGIS · Snowflake | Whatever your data lives in, we can plumb it. |
| Infra | AWS · GCP · Cloudflare · Vercel · self-hosted | We've shipped on all of these. Tile servers and CDN included. |
A navigable structure for your data. Not "a dashboard" — a way of seeing.
Power features for power users, sensible defaults for everyone else.
Keyboard navigation, screen-reader labels, color-blind palettes — built in, not bolted on.
Real numbers. Sub-200ms interactions, < 2s first-meaningful-paint, even at scale.
Interview your users. Understand the actual decisions the tool needs to support.
Sketch the information architecture. Iterate on low-fi before pixel-pushing.
Visual + interaction design. Tested with your users at each loop.
Engineer with your team or solo. Production deploys, observability baked in.
Ship, observe, refine. Optional maintenance contract after launch.
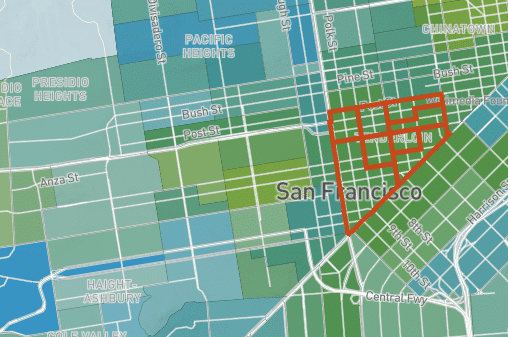
California county-level health outcomes, navigable for researchers, journalists, and policymakers.
Case study
A live climate-data dashboard powering daily news content for partner outlets.
Case study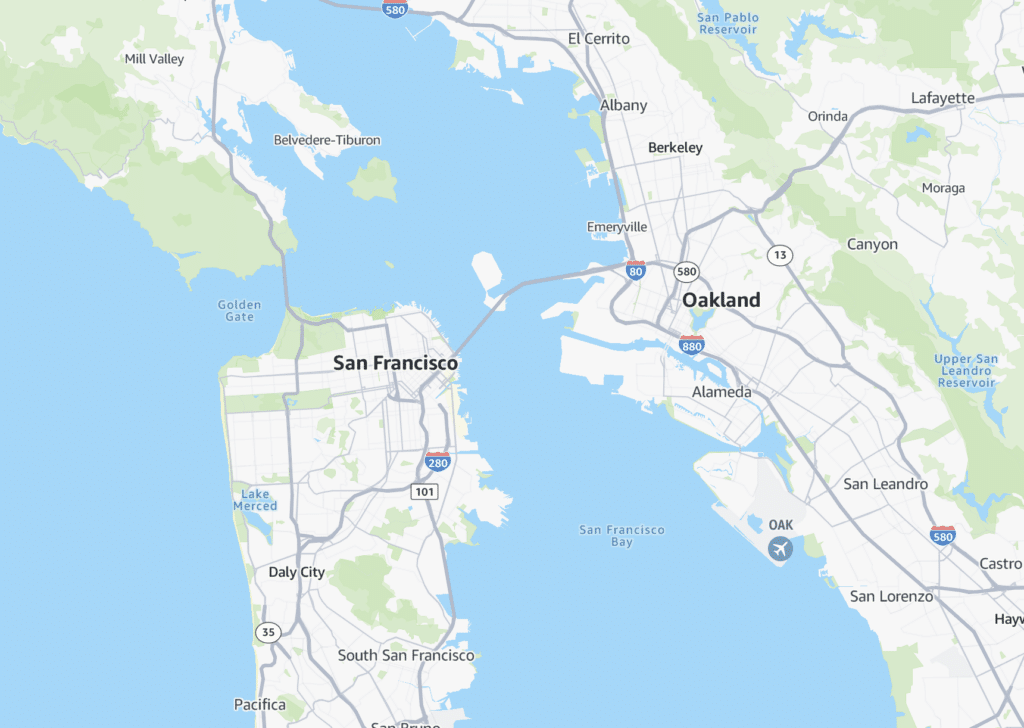
UX work supporting the AWS Location Service product — making spatial APIs approachable for non-GIS developers.
Case studyAlways. We've extended design systems for Google, Tableau, the Washington Post, and dozens more. Your brand, our craft.
We can plumb most of them. Snowflake, BigQuery, PostgreSQL+PostGIS, DuckDB, S3 parquet, weird internal APIs — we've shipped on all of them.
Yes — built in, not bolted on. Keyboard nav, screen-reader labels, color-blind palettes, motion preferences. We meet WCAG AA by default and AAA on request.
Yes, as a separate contract. Most clients take 6–12 month maintenance after launch.
"We exist to make data insightful and actionable. The interactive piece is where that actually happens."
Studio principle
Brief us. We'll send a scope estimate within the week.