Brain Cartography for UCSF
Mapping speech in the human brain.
View live project →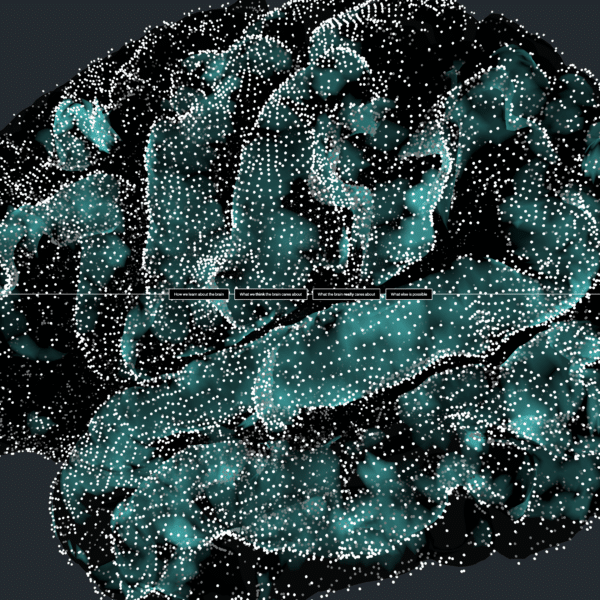
Background
The Chang Lab at UCSF, a team of neuroscientists studying how we produce and process speech, conducts pioneering neurosurgery for restoring speech in paralyzed patients. Communicating the value of their work to people outside the lab — with varying degrees of technical knowledge — is crucial to both integrating and furthering their research.
The challenge: take a body of work that is dense, three-dimensional, and full of specialized vocabulary, and translate it into something a journalist, a policymaker, a curious 12-year-old, and a peer scientist could all use productively. Not "dumbed down" — re-staged.
What we built
We designed and built an MVP interactive experience that guides users through learning about the research underway in the lab — from the methodology of how data is collected and insight is derived, to specific areas of research. Using narrative, illustration, and cutting-edge three-dimensional mapping technology, we collaborated with researchers at the lab to create a mobile and desktop experience that would inspire and illuminate, all while establishing a bespoke visual language that could translate the almost unimaginable wonder of the lab's groundbreaking work.
"We wanted readers to feel the geography of the cortex — not just learn its names."
Process
Listening sessions
Six weeks of interviews with researchers, surgeons, and former patients. What did they wish journalists understood?
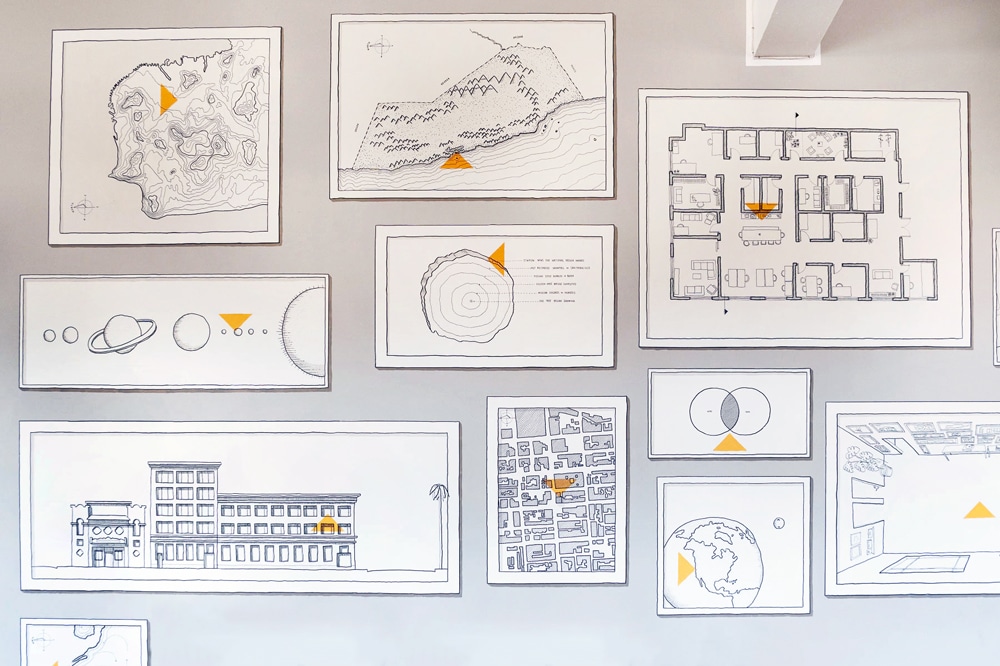
Visual language
A bespoke palette + line system. The cortex gets rendered as a kind of toner-map — hairlines and yellow accent.
3D prototype
Real anatomical brain models in WebGL, navigable at 60fps on a 2020 iPhone.
Narrative passes
Three drafts of the on-screen copy — reviewed by the lab's neuroscientists, a science journalist, and a non-specialist test panel.
Accessibility audit
Keyboard navigation, captions, motion-reduce variants. WCAG AA across the board.
Launch + measure
Shipped to brain.ucsf.edu (placeholder). 200K+ unique visitors in the first quarter; coverage in Nature, the Atlantic, and NPR.
Outcome
Beyond the metrics: the lab now uses the interactive as a recruiting tool — for new researchers, new patients, and new funders. The MVP is being extended into a permanent exhibit at the Exploratorium in San Francisco.
Tech stack
| Layer | Tools |
|---|---|
| 3D / WebGL | Three.js · custom shaders · GLB pipeline from FreeSurfer |
| UI | React 18 · CSS modules · Framer Motion |
| Type | Custom illustrated wordmark · HelveticaNeue body |
| Hosting | Cloudflare Pages · edge-cached 3D assets |
| Analytics | Plausible (privacy-respecting) |